Rhodamine diffusion experiments
In effort to understand the model, I have been studying simple diffusion experiments using rhodamine, a small molecule expected to experience little hindrance. The model currently expects a small molecule the size of rhodamine to reach equilibrium within 1.5 hours. In the following figure, the retentate is blue while the filtrate is green.

I assembled the experimental system using a sepcon with 3 ul of .5 mM rhodamine in 100 mM KCl on the top and 3 ul of 100 mM KCl on the bottom. The Tecan Nanoquant plate made it possible to test these tiny volumes after 1.5 and 3 hours. Here are the results:
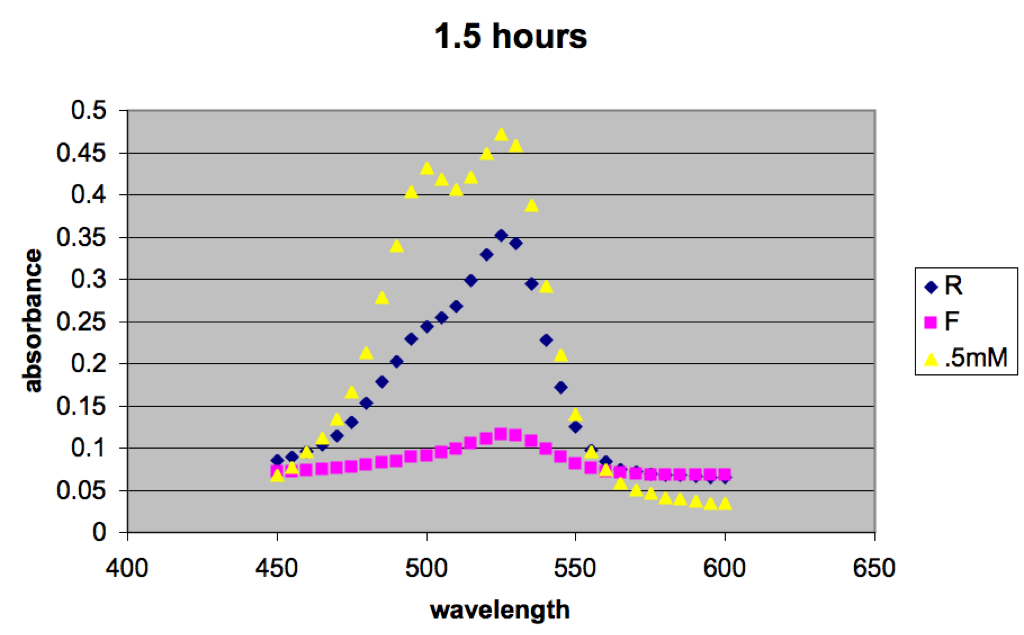
At 1.5 hours, the retentate has reduced in concentration while the filtrate has increased. The retentate to filtrate ratio (sieving coefficient, S) is about .33, indicating that we haven’t reached equilibrium yet (S=1 at eq).
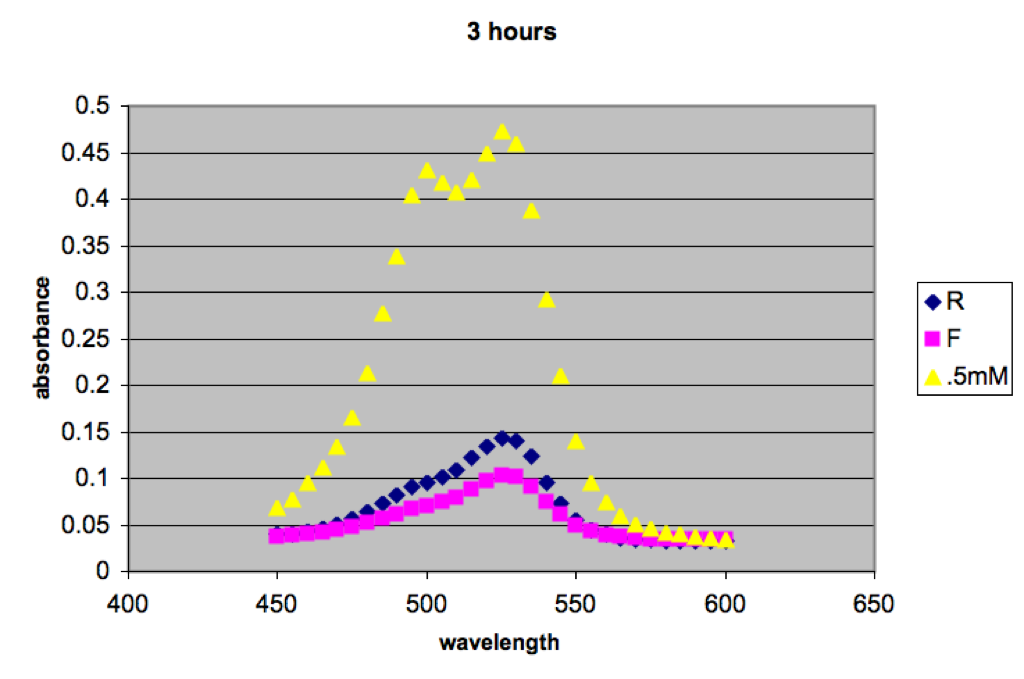
After 3 hours we are much closer to equilibrium; the ratio is now .72. This reemphasizes the discrepancies between the model and experimental systems. This separation is in “high” salts, however there may still be electrostatic effects.
It doesn’t look like the filtrate changed much in the two images, and that may be due to the lack of blanks, although loss of retentate by adsorption is a concern. Fluorescent images will be up soon to confirm.
UPDATE:
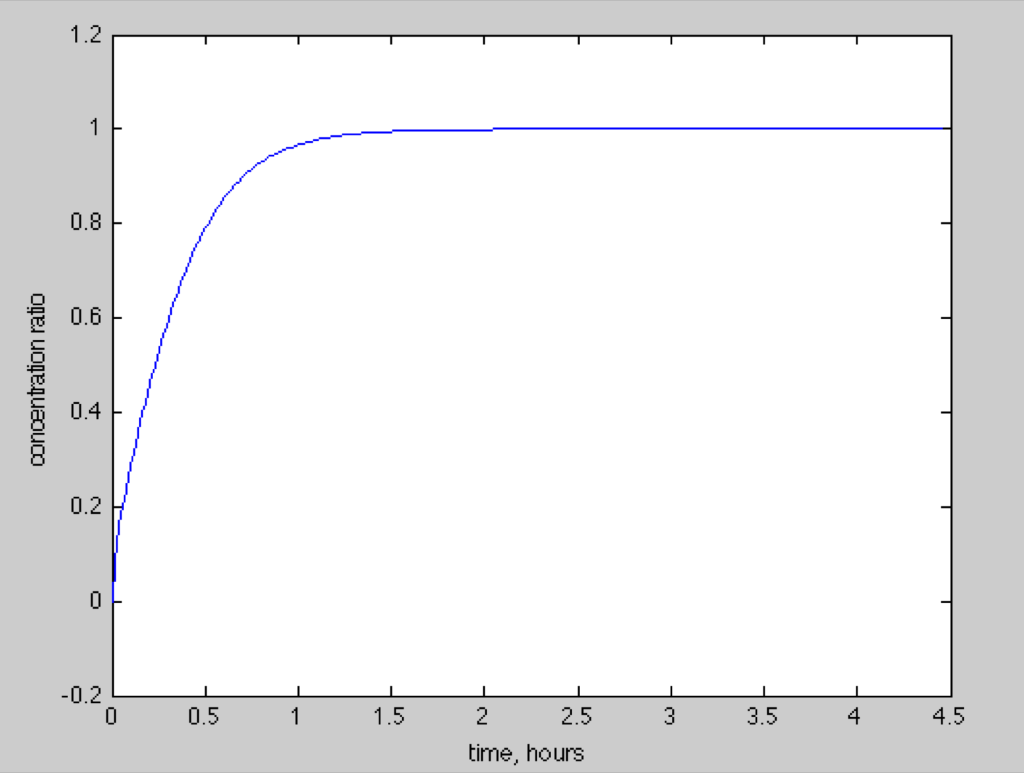
Ratio of Filtrate/Retentate over time. We’re pretty close to equilibrium at 1 hour, which is quicker than the experimental results.
What are ‘blanks?’
Can you plot the predicted retentate to filtrate ratios vs. time so we can see how far off you are.
Blank as in the traditional spec blank. I just used the sample directly on the quartz, but there seems to be a small difference in the baseline.
I made a new updated figure by taking figure 1 and dividing retentate by filtrate for each time point.